
Figma Plugin v0.5.0 Free to start

Audit your designs
like an instrument.

90 automated rules across 17 focus areas cover contrast, layout, typography, heuristics, and color — each scored, graded A–F, and fixable in one click. Get a second opinion from 15 AI models.

No signup required · Runs entirely inside Figma

Veris
Dashboard
Selection Page
A 94

Excellent — this design is in great shape.

Homepage / Hero

0 err 4 warn 54 pass
97 Contrast
0 err 1 warn
92 Layout
0 err 1 warn
91 Typography
0 err 1 warn
98 Heuristics
0 err 0 warn
93 Color
0 err 1 warn

Top findings

warn
Consider optical sizing for display text Display / Hero Text
warn
Subtle hue variance across neutral greys Global / Neutrals
90 Automated rules
6 Audit categories
15 AI providers
A–F Grade scale

Features

Built for rigour,
not reassurance.

90

Deterministic rules

Organised into 17 focus areas. Every check is documented. Contrast ratios computed with alpha compositing. Spacing verified against 8pt grids. Each rule references a specific WCAG criterion or Nielsen principle — no guesswork.

WCAG 1.4.3 WCAG 2.5.8 Nielsen #4 Apple HIG Material 3
One-click fixes

Applied directly on canvas. Verified before the issue closes. Undo any change instantly.

A–F grading

Scored 0–100, weighted by severity. Errors count 3× more than warnings.

15 AI providers

Bring your own API key. Claude, GPT-4o, Gemini, and 12 more run in parallel — results attributed per provider.

Library compliance

Register your component library. Detached instances, drift from canonical size, unregistered components.

JSON + PDF export

Full audit as structured JSON or formatted PDF. Built for handoff, post-mortems, and design reviews.

How it works

Three steps.
Zero ambiguity.

Select scope
Selection Full page
Homepage / Hero
Running 90 rules
contrast.wcag-aa
layout.touch-target
typography.line-height
color.palette-size
heuristics.feedback
Fixing issues
contrast-too-low
font-size-too-small
touch-target-size Fixed
Score 74 → 89
01

Select

Choose any frame or your entire page. Veris works at any scope — a single component or a full-page mockup.

02

Audit

90 rules run in parallel. Contrast computed with alpha compositing. Spacing checked against 8pt grids. Results scored by severity and graded instantly.

03

Fix

One click applies and verifies each fix directly on canvas. The score refreshes live. Export as JSON or PDF for handoff.

Audit categories

Six lenses.
One score.

Every audit runs all six evaluators in parallel, then combines them into a single weighted grade.

30%

Contrast & WCAG 2.2

Text legibility against WCAG AA/AAA — including opacity, gradients, and colour-blind safety.

20%

Layout & Spacing

Spacing grids, alignment, padding symmetry, off-canvas elements, and minimum touch-target sizes.

20%

Typography

Font sizes, line height, hierarchy, weight contrast, and typeface variety across the design.

20%

UX Heuristics

Nielsen's 10 principles plus Laws of UX mental-model checks — feedback, control, consistency, error prevention, cognitive load, and dark-pattern detection.

10%

Color

Palette size, near-duplicate colours, saturation balance, and colour-only information encoding.

+10%

Design Library

Component coverage, unregistered instances, detached components, and size drift from registered specs.

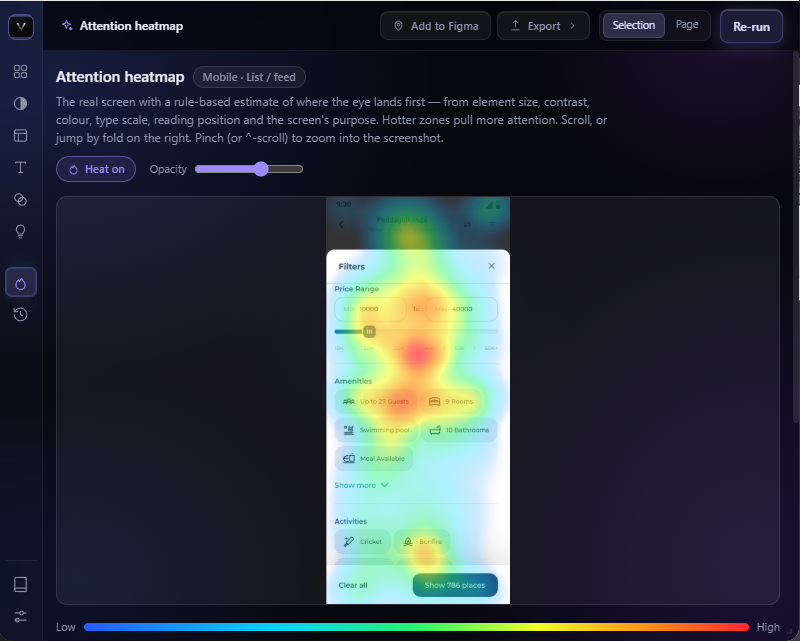
Attention heatmap

See what users
see first.

A rule-based saliency model overlaid on your actual screen — grounded in Itti–Koch attention research and Nielsen Norman Group eye-tracking studies.

  • Fold-aware budget. Each viewport slice gets its own attention budget — above-the-fold elements rank higher.

  • F-pattern & central-fixation prior. Reading-pattern bias resets per fold, so every scroll depth is modelled correctly.

  • Gaze magnets. Element size, contrast, colour warmth, type weight and interaction presence all contribute to the score.

  • Top 5 attention magnets listed with their exact drivers, so you know why each element pulls focus.

  • Pinch or ctrl-scroll to zoom into any part of the heatmap overlay.

Heat scale

Low attention High attention
Veris — Attention
Veris attention heatmap overlaid on a design frame
Heatmap view · fold 1 of 3

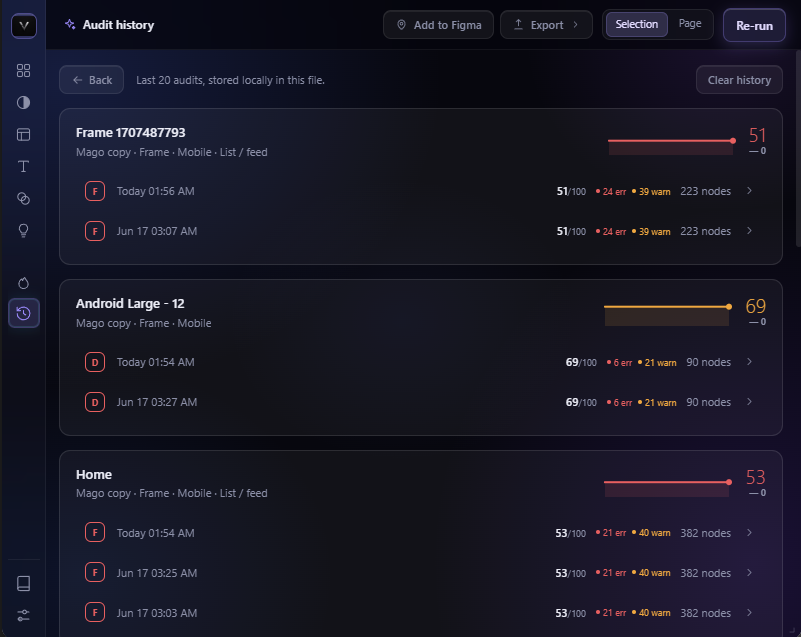
Audit history

Track every audit.

Every completed audit is stored locally in your Figma file. Watch your score trajectory move over time — run by run, frame by frame.

Score trend · example

78 +23
  • Up to 20 audits stored per file

    Saved in Figma clientStorage, scoped to the file and grouped by audited target — file, page and frame.

  • Sparkline score trend per target

    Each audited frame shows its run-by-run score as an SVG sparkline with a delta badge for improvement or regression.

  • Re-open any past run

    Click a historical audit to reload its full results, issue list and category scores — exactly as they were when it ran.

Veris — History
Veris audit history view showing score sparklines and run breakdown
History view · grouped by audited frame

AI analysis

Bring your own AI.

All analysis uses your API key, runs inside Figma, and never touches a third-party server.

Claude GPT-4o Gemini Groq OpenRouter Azure OpenAI GitHub Models Mistral Together AI DeepSeek xAI / Grok Cerebras Fireworks AI Perplexity Ollama · local
Ollama · local Perplexity Fireworks AI Cerebras xAI / Grok DeepSeek Together AI Mistral GitHub Models Azure OpenAI OpenRouter Groq Gemini GPT-4o Claude

Ollama runs entirely offline — no API key required.

Scoring system

Numbers that mean something.

F 0–59 D 60–69 C 70–79 B 80–89 A 90–100

Scores use a damped sigmoid formula so a design with a few warnings lands around 70–80, not near zero.

Severity weights

Error
×12
Warning
×4
Info
×1

The overall score is a weighted average across all 6 categories: contrast at 30%, layout/typography/heuristics at 20% each, color at 10%.

Inside Veris

See it in action.

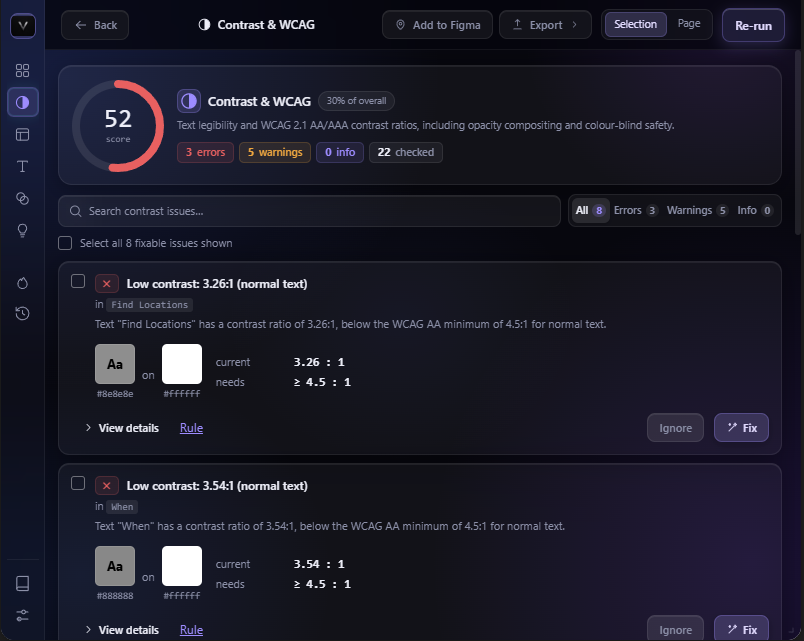
Every issue is actionable — three severity levels, searchable and filterable, with one-click fixes verified on canvas and a live-refreshing score.

Veris — Results
Veris detailed results view with severity-grouped issues and one-click fixes
Detailed results Severity levels · search & filter · per-issue detail · one-click fix with verification · undo & live score refresh.
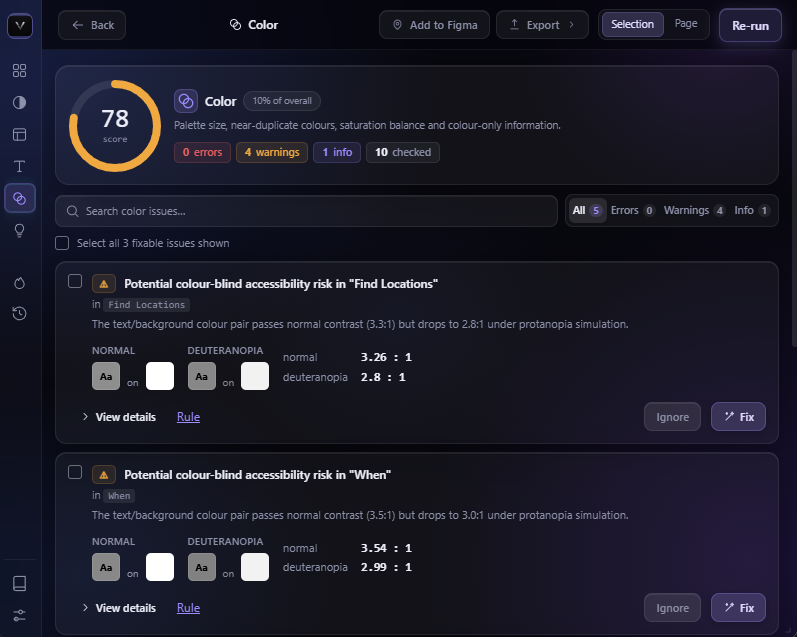
Veris — Colour
Veris colour analysis view showing contrast ratios across the design
Colour analysis Every ratio, every pixel — WCAG AA/AAA contrast computed with alpha compositing and colour-blind safety.

Pricing

Start free.
Go unlimited.

Free

$0/month

Start auditing immediately — no credit card, no account.

  • 10 audits / 30 days
  • All 90 automated rules
  • All 6 audit categories
  • AI analysis (BYOK)
  • JSON + PDF export
Install free
Recommended

Pro

Unlimited audits across all your devices.

  • Everything in Free
  • Unlimited audits
  • Multi-device activation
  • 7-day offline grace period
Get Pro

Billed monthly via Lemon Squeezy · Cancel anytime

FAQ

Common questions.

Does Veris send my designs anywhere?

Never. All evaluation logic runs inside Figma's UI iframe — your design data never leaves Figma. When you enable AI analysis, only a structured text summary (not raw node data) is sent to your chosen AI provider, using your own API key.

How does the free tier work?

You get 10 complete audits every 30 days, per device. No signup, no account — just install and run. Cancelled or errored audits don't count against your quota. The counter resets on a rolling 30-day window.

Which AI providers are supported?

15 providers: Anthropic Claude, OpenAI, Google Gemini, Groq, OpenRouter, Azure OpenAI, GitHub Models, Mistral, Together AI, DeepSeek, xAI/Grok, Cerebras, Fireworks AI, Perplexity, and Ollama. Ollama runs fully offline — no API key required.

Can I activate on multiple devices?

Yes — Pro licenses support multiple device activations. The exact limit is shown at checkout. Licenses also include a 7-day offline grace period, so your audit access stays available if you temporarily lose connectivity.

Does it audit nested components and instances?

Yes. Veris walks the full node tree, resolving INSTANCE nodes to their main components. Library compliance checks specifically target instances and detect detached components by name. Up to 10,000 nodes per audit.

How is the overall score calculated?

Each category is scored 0–100 using a damped sigmoid: errors count 12 points each, warnings 4, info 1. The overall score is a weighted average — contrast at 30%, layout/typography/heuristics at 20% each, color at 10%. Design Library compliance optionally takes a 10% slice when enabled.